Database Health Monitor 4.1818: Build Your Own Dashboards, Plus 9 New Reports and Pop-Out Windows
Database Health Monitor version 4.1818 is the release where you stop reading our dashboards and start building your own. It adds a Dashboards page where you lay out boards of charts, KPI tiles, tables, gauges and heat maps for one server or for every server you monitor, share them through the history database, and show them on a wall. Every instance report in the product gets a tile you can drop on a board. On top of that there are 9 new reports, a way to pop any report out into its own window, a Patch Currency report that tells you how far behind each instance’s build is, Excel exports that finally hold real numbers, and 672 fixes.
This post goes through the whole release. It is long on purpose, the way the 4.1796 post was, because the fastest way to decide whether a feature matters to you is to read the question it answers and notice whether you have been asking it. If you only want the headline, read the Dashboards section and the list of new reports, then come back for the rest when you have the installer running.
Two themes in one release
The new features in 4.1818 have one theme: seeing the estate the way you want to. Database Health Monitor has always had a fixed set of overview pages, each designed by us and the same for everyone. They are good pages, but every team watches something slightly different: backup age for one, page life expectancy and blocked sessions for another, deadlocks per hour on a wall in the operations room for a third. Custom Dashboards let each of those teams build the page they would have designed themselves, and the pop-out windows let a report live on screen while you work in the main window.
The new reports have a different theme: what the plan cache and the catalog cannot say on their own. Most query reports read the plan cache, and the plan cache keeps aggregates. It can tell you a statement averages 400 milliseconds. It cannot tell you that most calls take 40 milliseconds and the unlucky parameter takes 9 seconds. It cannot show the statements that recompile on every call, because they never leave a row behind. It cannot say which foreign key answers a parent delete with a scan of 40 million rows, or that a column declared nvarchar(4000) has never held anything but eight ASCII characters. The nine new reports each take one of those blind spots and fill it with evidence from your own server.
As before, instance reports run from the instance node in the tree and database reports from a database node. Patch Currency lives on the Performance Dashboard because it is about every instance you have saved.
Custom Dashboards
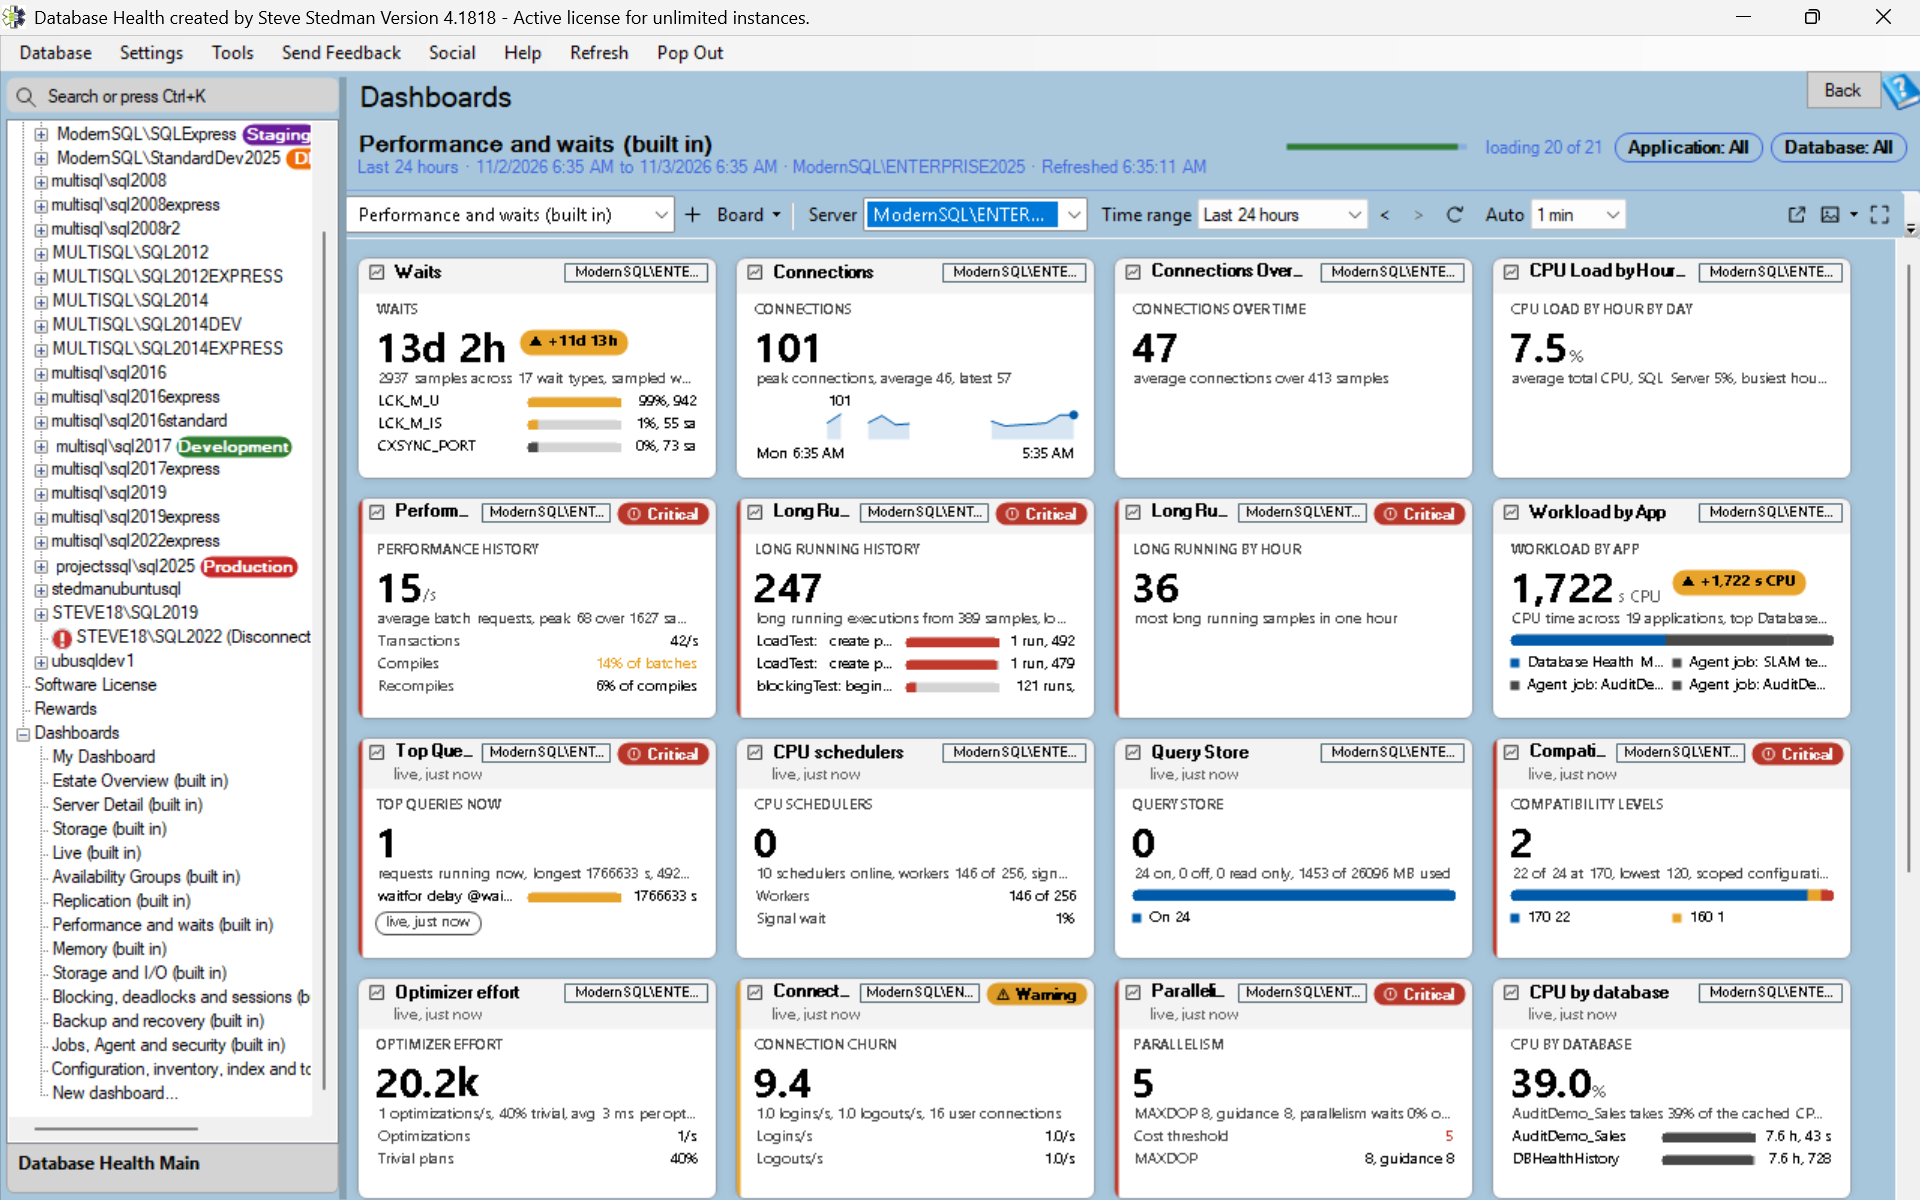
The Dashboards page is under the Overview pages. The first time you open it, the page offers three ways to start: add a widget, start from a template, or import a board someone sent you. A board is a 12 column grid, and each widget on it shows one thing. You can keep as many boards as you like, switch between them with a board picker or Ctrl+Tab, and make one the board the page opens on.
The widget types
A time series chart plots a metric over the time range, with up to eight lines: several metrics for one server or several servers for one metric, with a legend that shows each line’s latest value and hides a line on click. Two different units get a second axis on the right. Amber and red limits draw as rules and a red band. A single line chart can draw as line, area, bars or step, with an Auto setting that picks bars for hourly counts such as deadlocks per hour and step for age metrics, and a moving average overlay is one tick box away.
A KPI tile shows one number with a caption, a unit, a detail line, a sparkline and a trend chip against the previous period. Set the server to all servers and it combines them with Max, Average, Sum or Count. A status list shows several metrics as rows, each with its state. A Top N table lists the worst rows of a grid, such as the slowest queries or the fullest drives. A gauge draws a bounded metric such as a percent or free space as a 180 degree arc with the amber and red bands on the arc, and with the server set to all servers it draws one small arc per registered server, which is a quick way to spot the one instance that is different.
A punch card draws an hourly count such as deadlocks per hour as a grid, one row per day and one column per hour, each cell shaded by its count, so a pattern like “every weekday at 02:00” shows as a dark vertical stripe. An estate heat map shows one cell per registered server, and an estate matrix puts the servers down the side and up to eight metrics across the top with a colored cell where they cross. A stat strip packs a row of small numbers. A text note holds headings, bullets, check boxes, links and values taken from the board in a small Markdown subset, and a check box ticked in view mode stays ticked across a refresh and a restart, so a runbook note becomes a shift checklist. Clock and image widgets round out a wall board, and each data widget has an amber and a red limit with per metric defaults.
A tile for every instance report
The widget that ties the Dashboards page to the rest of the product is the Report summary tile. Every instance report has one. History tiles read their number from the history database and follow the board’s time range. Live tiles run one small query against the instance, with a 5 minute cache, a timeout and one query per server at a time, so a wall of live tiles does not become a load on the servers it is watching. Link tiles show the report’s description and keywords and are a large button into the report. A single click on any of them opens the report for that server.
More than 90 of those tiles show the report’s own headline rather than a link, each drawn in the shape that fits its data: sessions by state as segments, blocked sessions and root blockers as node flows, the top wait types as bars, and backup exposure, failed jobs, disk space with days to full, the Security Posture score and the Quick Scan score as facts, progress bars, score rings, trend lines and timelines. The widget dialog marks each report as live, history or link, so you know before you add it whether it will show a number.
Edit mode
Click Edit and the grid guides appear. Drag a widget by its header to move it and by a corner to resize it, and a dashed ghost shows the cells it will snap to. A widget palette adds new ones, multi select lets you align, distribute and auto arrange a group, and there are section dividers, inline rename, undo and redo, with keyboard equivalents for all of it. Nothing is kept until you click Save, and Cancel discards without asking, which is the behavior we wanted for a page where experiments should be cheap.
Built in boards, sharing and files
The program ships read only boards so a new install is not an empty grid: Estate Overview, Server Detail and Storage, seven category boards that follow the report categories from performance and waits through configuration, inventory and tools, and a board for Availability Groups and Replication. Each has a board level server selector, so one board works for any instance, and Duplicate gives you an editable copy.
Sharing goes through the history database. Publish a board to the server your team uses and everyone who can connect to that history database sees it, with a thumbnail, a description and who changed what. Open a copy of a shared board and it stays linked, so an update available mark appears when the shared version changes and Update my copy brings yours forward. Boards also export and import as .dhdash files, and a board history with restore and a rolling backup protect against the mistake you did not notice until next week.
Charts that explain themselves
Dashboard charts have gridlines, a readable y axis, a last value marker and a hover crosshair synchronized across the whole board. Event markers show restarts, deadlocks, alerts sent, schema changes, memory pressure and failed jobs along the time line, which is often the whole explanation for the shape of the line above them. A previous period ghost line shows the same span just before, and a normal range band shows the 10th to 90th percentile of the same clock hours over the last four weeks, so a line that leaves the band is unusual by the server’s own standard. Drag to zoom, a projection line forecasts when a growing series is full, a chart marks where history begins and where the collector was not running, and a right click pins a note at a time that draws on every chart of that server.
Time range, refresh and alerts
The board range has presets up to 30 days, a custom window, step back and forward, and a scrubber under the header. Auto refresh has an interval picker and a countdown and pauses while you edit. Live metrics such as sessions, blocked now, CPU now and page life expectancy now poll the DMVs every 10 to 30 seconds, and a value older than expected shows its age in amber instead of pretending to be current. Thresholds have per metric defaults and limit profiles per environment, a tile that turns critical pulses, and the board can toast and chime with quiet hours and a mute per tile.
Wall, kiosk and pop out
Full screen (F11) shows the board with no window chrome. Wall settings choose the boards to rotate through, the dwell per board, the monitor and the background, with a preview of the next board and support for two monitors. An attention layout collapses the tiles that are OK into an All OK strip so the tiles that need attention grow to fill the screen. A kiosk command line switch opens a wall at sign in and recovers after sleep or a lost network, which is what a screen in an operations room needs. A board can also pop out into a slim window, a mini always on top ticker of the worst tiles, or a presentation mode.
For the people who will never open the program, a board prints, saves as a PDF or exports as a 2x image, and scheduled snapshots save a PNG or PDF of chosen boards to a folder or email them daily, weekly or every N hours, drawn off screen so the Dashboards page need not be open, with a command line switch to run them from a scheduled task.
The catalog, inspection and accessibility
History metrics grow from 17 to about 35 and Top N tables from 4 to about 14. Board variables add a Database, Drive or Application picker in the header, an estate drill re-points a whole board from a heat map cell with Back to return, and an Inspect drawer per tile shows its data, its SQL, its timing and its state history. The page has tabular figures so numbers do not jitter on refresh, three density settings, every color routed through the theme with dark mode contrast verified, Windows high contrast support, regional date formats, full keyboard access, screen reader announcements when a tile gets worse, touch gestures and a help page on F1.
Pop out any report into its own window
Troubleshooting usually needs more than one report on screen, such as Active Queries open while you watch Blocking Queries. In 4.1818 every report has a Pop Out button beside Refresh, an Open in New Window item on the Display menu and on the tab menu, and the Ctrl+K search can open a report straight into its own window.
Each pop-out is its own process, so a report that hangs freezes only its own window and never the main one. Drill-through, Back, Forward and F5 work inside the pop-out as they do in the main window. The window is started with the server name only, never a password, and it never writes the settings file.
New reports: workload and plan cache
Workload Sample
Every query page reads the plan cache or Query Store, and both keep aggregates. Neither can draw the spread of one statement’s calls, and the plan cache misses whole classes of workload: procedures created WITH RECOMPILE, statements with OPTION (RECOMPILE), encrypted modules and evicted plans. Workload Sample is an instance report that runs a short, bounded Extended Events capture of one to ten minutes and shows every statement that completed in it, with calls and calls per minute, the p50, p90, p99 and maximum duration, CPU, reads, rows per call, spills and the programs that sent it.
There are three views. Statements has one row per statement grouped by query hash. Distribution draws the selected statement’s calls by duration on a logarithmic scale, which is how a 40 millisecond query with 9 second outliers becomes visible. Events lists the spills with their actual sizes, the sessions that fetch from an API cursor, and the calls by program, host and login. At the end of the capture a Plan Cached column says yes, no or resets for each hash, which is what row by row fetch loops, prepared handle churn and statements that recompile on every call look like. The capture needs SQL Server 2012 or later and the permission to create an event session, and the session is dropped when the capture ends or you leave the page.
Plan Cache Churn
A plan cache that empties is a performance event that leaves almost no trace: the CPU spike from a few thousand compiles happens, the server settles, and an hour later nobody can say why. Plan Cache Churn draws the creation time of every cached plan over the last 6, 24 or 72 hours and finds the cliffs where hundreds of plans were born at once because the cache was emptied. It names the likely cause from the error log, the default trace and the ring buffers: a restart, memory pressure, DBCC FREEPROCCACHE, an ALTER DATABASE or a RECONFIGURE. When Query Store is on, it lists the queries whose plan came back different after the flush, which is the list of statements that may have regressed. It also measures turnover as plans compiled per minute against plans evicted per minute, so a cache churned by unparameterized SQL shows as a rate and not as a feeling.
Auto Statistics Activity
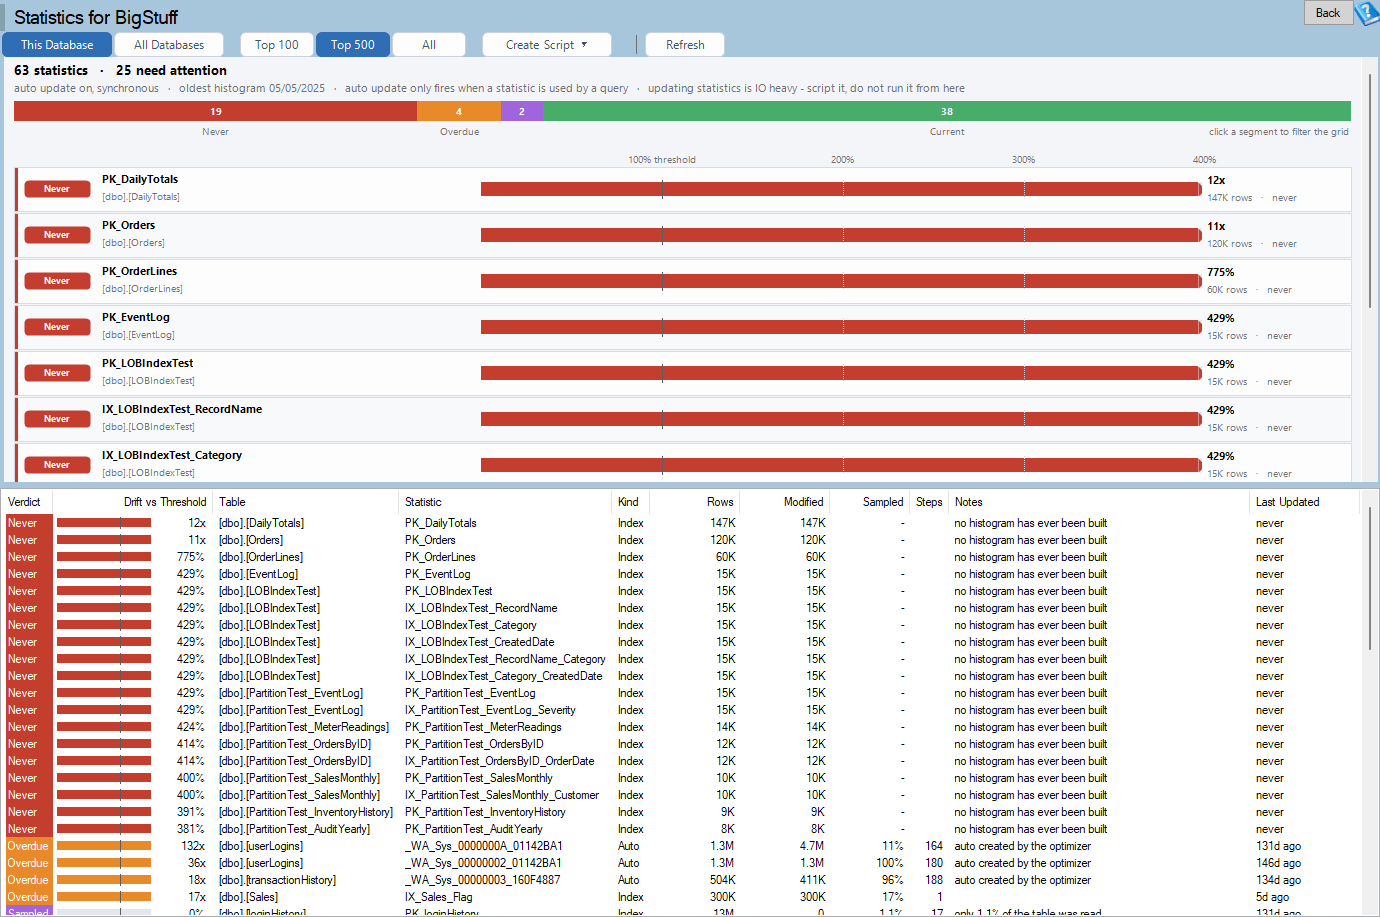
The Statistics page ranks statistics by how far they have drifted past the automatic update threshold, which tells you what will update next. It cannot tell you that a 400 million row table’s automatic update ran synchronously for 94 seconds inside a user’s query, that it sampled 0.4 percent and replaced the full scan histogram the nightly job built, or that a queue table’s statistic has updated 38 times since lunch. Auto Statistics Activity captures the auto_stats and recompile events for a window of 2 to 30 minutes and shows exactly that.
The Events view lists each automatic update in time order with the sample percent chosen, the stall it caused inside the triggering query when it was synchronous, and the statement that triggered it. Hot Statistics groups the updates by statistic with the automatic sample against the maintenance sample, and Recompiles names the hot statistic when it is the reason a statement recompiled. The Lifetime view reads the StatMan statements already in the plan cache with no capture, so it works on SQL Server 2008. The advice is specific: NORECOMPUTE with a scheduled update for a hot statistic on a small high churn table, PERSIST_SAMPLE_PERCENT or a FULLSCAN job where the automatic sample is a tenth of the maintenance sample, and AUTO_UPDATE_STATISTICS_ASYNC where synchronous stalls run over a second. Right click a hot statistic for the scripts. The page never runs them.
ORM Workload Profile
Each symptom of a data access layer already has a page: Workload by Application attributes cost to programs, Chatty Queries finds N+1 loops, Queries Needing Params finds literal SQL, Plan Warnings finds implicit conversions. None of them says “this is Entity Framework Core behind program X, it sends every string as nvarchar(4000) against your varchar columns, and its transactions are SERIALIZABLE”. ORM Workload Profile joins them by program and names the framework.
It identifies the stack from the fingerprints frameworks leave: EF6 names derived tables Extent1 and Project1, EF Core aliases a table [e] and names parameters @__p_0, Hibernate aliases a table customer0_, the Microsoft JDBC driver sends sp_prepexec with @P0, Access sends sp_cursoropen, and Dapper keeps the parameter names the developer wrote. Then it scores what each program is doing to the instance: nvarchar parameters against varchar columns, SERIALIZABLE sessions from a default TransactionScope, implicit transactions left open, SET chatter, N+1 loops, prepared handle churn, client side cursors, literal SQL, huge IN lists, and ARITHABORT OFF plans that differ from the ones tested in SSMS. Each finding comes with the fix in that framework’s own vocabulary, and a right click copies a Markdown summary for the developers.
New reports: queries
Query Findings
The product has many query pages and each ranks by its own measure. The same statement can sit on eight of them and nothing says so. Query Findings is a database report that reads the plan cache once and, for each statement, collects every finding that can be made from its plan, its text and its counters under one query hash: plan warnings, anti-patterns, estimate errors, sniffed parameters, spills and grants, read amplification, missing index requests, large scans, result sets that swing from one row to thousands, and plans used once. Each finding has a severity, the findings add up to a score weighted by the statement’s share of the database’s CPU, and the statements are ranked by score. Tuning starts from the ten statements with the most wrong with them, which is a different list from the ten most expensive and usually a more useful one.
The sweep takes the top statements by CPU, by logical reads and by executions with one budget, and a statement outside the sweep is reported as not swept rather than as clean. A bar chart has one bar per finding type, and a click filters the grid to the statements that carry it. Select a row for its findings, worst first, each with its evidence and a one line fix, and Open page goes to the report that explains it.
Unstable Queries
“This query is sometimes slow” is the hardest complaint to tune, because the average hides it. The plan cache has kept the best, worst and most recent value of every counter of every statement since SQL Server 2005, and until now no page read them. Unstable Queries lists each statement with its minimum, average, maximum and last elapsed time, CPU and reads, plus the rows, memory grant and degree of parallelism where the server records them, so a query that averages 400 milliseconds because it takes 40 milliseconds for most callers and 9 seconds for the unlucky parameter is separated from one that takes 400 milliseconds every time.
The value over a raw minimum and maximum is the classification, because which counter varies tells you where to go next. Reads and rows that both spread point to a data volume parameter. Elapsed time that spreads while reads hold steady means the statement waited rather than worked. A grant that varies is a sniffed sort or hash, a degree of parallelism that varies is thread starvation, and a last run at three times the average within the last hour is flagged as regressed recently. Every row names the next report, and the page works on every instance since SQL Server 2008 whether or not Query Store is on.
New reports: tables and keys
Foreign Keys
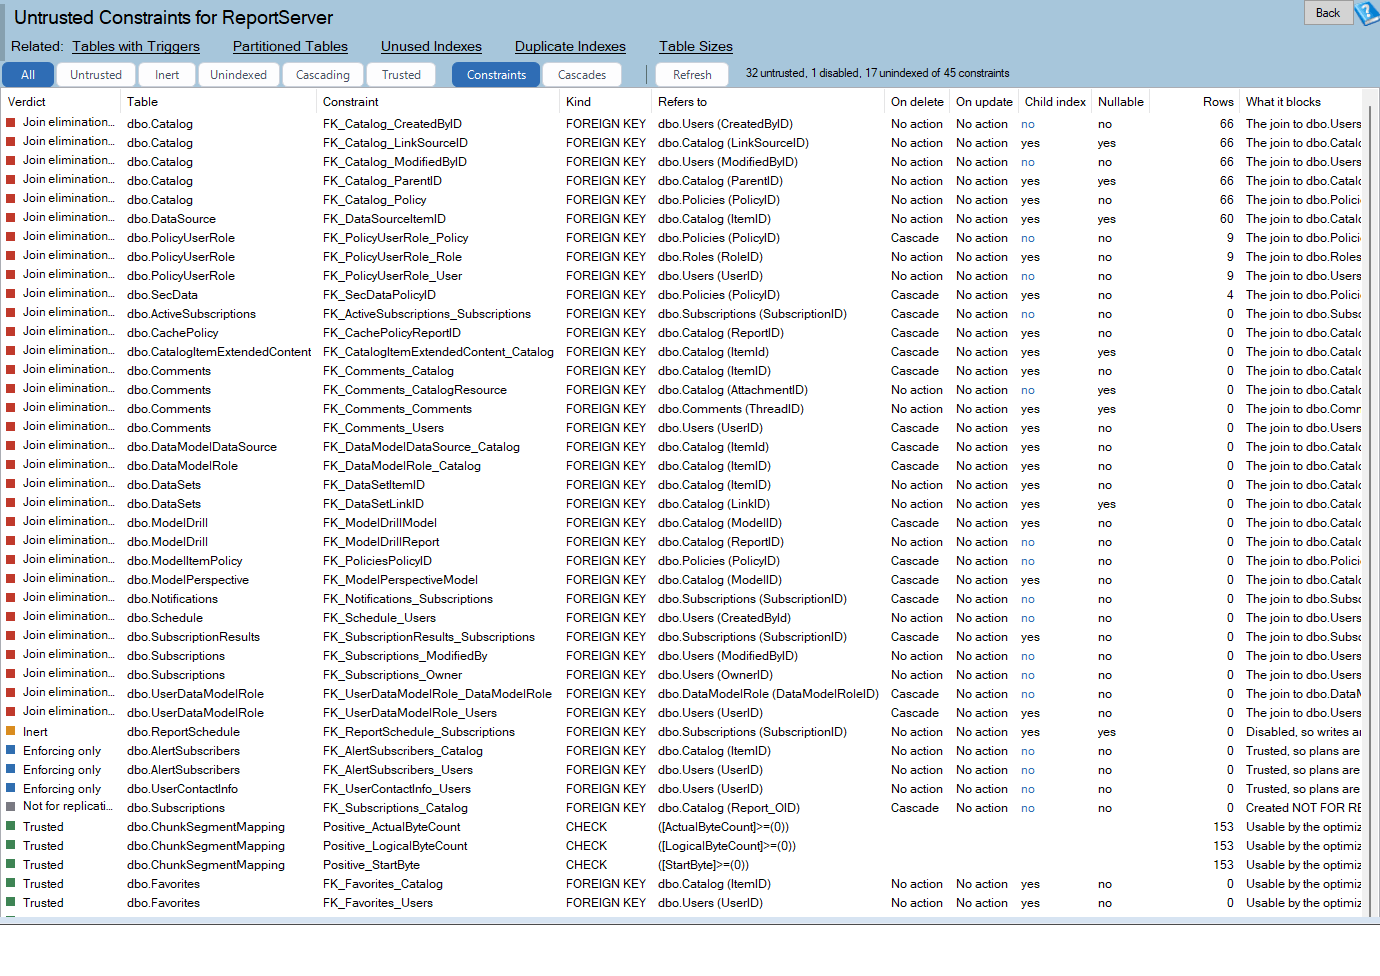
Every parent delete or key update asks the engine one question: is any child row pointing here? An index on the child columns answers with a seek. Without one, a scan of the child table answers it, in a plan nobody wrote. An unindexed key on a child of 200 rows is nothing. On a child of 40 million rows whose parent deletes 500 rows a day it is 20 billion rows read a day. The Foreign Keys database report lists each key with the cost, not just the lint: the child rows, the parent delete and key update rate per day, the covering index or none, the columns whose type or collation differ so every join converts, the cascade chains, and the untrusted and disabled keys the optimizer cannot use to eliminate joins.
The Evidence view reads the busiest 400 cached plans and lists the ones that scan a child table under a parent DELETE or UPDATE, with executions per day and reads per execution. The Scripts view writes the CREATE INDEX for each unindexed key and the re-check statement for each untrusted key, and nothing is ever run from the page. The Table Tuning Advisor gains an unindexed foreign key finding so the same fact surfaces where you tune a table.
Row Width and Data Types
Every scan reads pages, and a page holds a fixed number of bytes. A table of nvarchar(4000) codes that hold eight ASCII characters and datetime columns that never hold a time stores far fewer rows per page than the data needs, and the optimizer sizes every sort and memory grant from the declared widths rather than the data. Row Width and Data Types measures how wide each table’s rows really are against the declared maximum, how many rows fit on a page now and how many would fit if the columns were sized to the data they hold, and names the columns whose declared type is wider than any value in them: nvarchar with no non ASCII value, datetime holding only dates, bigint holding small integers, char that is mostly padding and int flags that are bits.
The Columns view shows the probes for the selected table with the suggested type, the bytes saved and a risk note, the Grants view compares the optimizer’s row size against the measured record size for the top plans, and the Scripts view writes the check to run first and the ALTER COLUMN. The largest 20 tables up to 10 million rows are measured when the page opens, and a Measure button samples any larger table on request, so opening the page never becomes a scan of your biggest table.
New report: estate
Patch Currency
The Patch Currency report is on the Performance Dashboard, so it covers every saved instance at once. There is one row per instance, worst first, with its build, friendly name and branch, the latest cumulative update on that branch, how many updates and days behind it is, the security builds it has missed, the mainstream and extended support end dates, and an overall status. An unknown build is never reported as current, and Azure SQL Database and Managed Instance are listed as evergreen.
The part that matters for trust is where the numbers come from. Every figure is read from one shared SQL Server build catalog, and that same catalog is now what the update available check, the masthead chips, Quick Scan and the silent report generator read too. Before this release those paths each had their own idea of the latest build and could disagree with each other. Now they cannot. The catalog was refreshed for this release.
Everyday use
Excel exports hold real numbers
Save as Excel now writes numbers, dates and values with units such as GB, ms and percent as real cell values with number formats, under a bold, frozen, filtered header with fitted column widths, so SUM, sorting and charts work in Excel without reformatting. It is a small change with a large effect on anyone who ships a weekly spreadsheet from a report. In the same spirit, the value list in a grid column filter is now sorted alphanumerically.
Security Posture export
Export Security Posture on the grid and band menus writes the whole run to a Word document, passes and manual checks included, whatever the band is filtered to, with the SQL Server and operating system versions at the top. A posture review can be sent as a record of every check that was made, not only of the ones that failed, which is what an auditor usually asks for first.
Plan Viewer opens more than one plan
Drag a .sqlplan file onto the Plan Viewer window, press Ctrl+O, or pick from a recent list to open another plan without relaunching. Esc closes, the title names the file, and Save Copy As replaces the Save that used to rewrite the opened file.
Tray Start and Stop Service do not block
The tray icon and the Manage dialog stay responsive while the monitoring service changes state. The menu and tooltip show Starting or Stopping, a balloon reports the result, access denied is explained, and Stop Service asks for confirmation and offers Snooze instead, because Snooze is usually what was meant.
672 bug fixes
672 bugs were fixed in this release across Database Health Monitor, Azure SQL Health Monitor, Schema Drift, Space Recovery, Query Loading Ramp, the monitoring service and the tray application, including 15 crash reports and 67 fixes in Azure SQL Health Monitor. The largest group came from the code review sweeps of the new Dashboards page and its tiles, which is what you would expect from a feature that size. After that came charts and grids that drew, filtered or clicked wrongly, reads that could not be cancelled, exports, the SSIS and SSRS pages, the deadlock and session waits pages, the Security Posture checks, and reports that gave wrong results on SQL Server 2008 and 2008 R2 and in non US cultures. Many of those came from users who sent a screenshot. Thank you.
A note on the Azure SQL Health Monitor
The Azure SQL Health Monitor ships from the same codebase and received 67 of the fixes in this release. Its report list is its own, so the new instance level reports in this post are for Database Health Monitor on SQL Server.
Questions we expect
Do I need the monitoring service to use dashboards? Live tiles and live metrics read the instance directly, so the desktop application alone will show a board of live tiles. History tiles, time series charts, the normal range band, event markers and shared boards read the history database, which the service fills. If you want a wall board that shows the last 24 hours, you want the service.
Where are my boards stored? Your own boards are saved locally and export as .dhdash files. A shared board is a row in the dbo.Dashboard table of the DBHealthHistory database on the server you publish it to, so everyone who can connect to that history database sees the same list.
Do the new reports need Extended Events? Workload Sample and Auto Statistics Activity create a short event session and drop it when the capture ends, so they need SQL Server 2012 or later and ALTER ANY EVENT SESSION. The other seven read the plan cache, the catalog or the operational stats and need no session.
What comes next
A few things did not make this release. The Query Store, timeout, lock footprint, chatty and thread skew findings are not yet part of Query Findings, and the paired rows per page chart in Row Width and Data Types is not drawn yet. They are the direction: every finding the product can make in one place, laid out however you like.
Upgrade
Version 4.1818 installs over your existing version and keeps your settings and history. The history upgrader brings an existing history database forward, including the dashboard table that shared boards use. Download it from the Database Health Monitor site, run the installer, and let it restart the service. Then open Dashboards under the Overview pages, pick Estate Overview, and set the server. If a report asks for a permission or a feature your SQL Server version lacks, the page says so plainly and offers the alternative.
As always, tell us what you find. Every report in this release started as a question someone asked us, and the dashboards started as a request we heard from more people than any other. The next release will come from the same place.