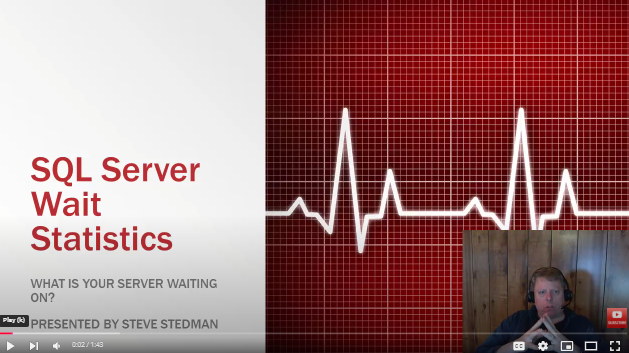
Wait statistics, in the context of SQL Server, refer to the amount of time that a query spends waiting to access data in the database. When a client application requests data from the database, the request is placed in a queue and the client application must wait for its turn to access the data. The time that the query spends waiting is called a "wait" and is tracked by SQL Server. This information can be used to identify potential performance bottlenecks and optimize the performance of the database. Wait statistics are commonly used by database administrators to diagnose and troubleshoot performance issues in SQL Server.
SQL Server in high availability environments can sometimes experience performance bottlenecks related to Always On Availability Groups. One wait type that often appears in these setups is HADR_BACKUP_QUEUE. Knowing what this wait type means and how to address it is critical for maintaining smooth database operations.
What is HADR_BACKUP_QUEUE?
The HADR_BACKUP_QUEUE wait type occurs when SQL Server is waiting for log records to be backed up to secondary replicas in an Always On Availability Group. These replicas must process the transaction log to ensure data consistency and high availability, but if the backups are delayed or there is contention, this wait type can appear.
In simpler terms, it’s like a queue forming for transaction log backups because the secondary replica isn’t processing them quickly enough. While brief waits are normal in high availability configurations, prolonged or frequent waits can signal a problem.
Why Does HADR_BACKUP_QUEUE Happen?
There are several reasons why HADR_BACKUP_QUEUE waits might occur, including:
- Slow network connections between the primary and secondary replicas.
- Secondary replicas struggling with resource constraints, such as CPU, memory, or disk I/O.
- Large transaction log volumes caused by high write activity on the primary replica.
- Insufficient configuration or outdated hardware on the secondary replicas.
- Delays in applying transaction log records on the secondary replicas.
Understanding the root cause of these waits is the first step in addressing them effectively.
How to Monitor HADR_BACKUP_QUEUE Waits
To track and understand HADR_BACKUP_QUEUE waits, using a monitoring tool like the Database Health Monitor is highly recommended. Its Historic Waits Monitoring feature provides detailed insights into wait types, including HADR_BACKUP_QUEUE.
Database Health Monitor allows you to analyze when and why these waits occur, helping you correlate them with system events like high transaction volumes or network issues. This data makes it easier to identify patterns and take the necessary actions to resolve performance problems.
What Can You Do About HADR_BACKUP_QUEUE Waits?
If you’re experiencing frequent or prolonged HADR_BACKUP_QUEUE waits, consider taking the following actions:
- Check the network connection between the primary and secondary replicas. Ensure it is fast and reliable with minimal latency.
- Evaluate the resource capacity of your secondary replicas, including CPU, memory, and disk I/O, and upgrade hardware if necessary.
- Optimize queries and indexes on the primary replica to reduce transaction log generation.
- Review the Always On Availability Group configuration to ensure it aligns with best practices for your workload.
- Distribute workloads evenly across the secondary replicas to prevent bottlenecks on a single node.
These actions can help reduce HADR_BACKUP_QUEUE waits and improve the overall performance of your Always On Availability Group.
How Stedman Solutions Can Help
At Stedman Solutions, we specialize in SQL Server performance optimization and troubleshooting, including resolving wait types like HADR_BACKUP_QUEUE. Our managed services offer proactive support to ensure your Always On Availability Groups are configured and operating at peak efficiency. Additionally, our Database Health Monitor is an invaluable tool for tracking and analyzing SQL Server waits, giving you the insights you need to maintain a reliable and high-performing environment.
If you’re dealing with performance issues or want to optimize your SQL Server, contact us today. Let us help you achieve a robust and efficient database system!

Find out more about our SQL Server Managed Services
Applies to
Related Waits
HADR_AG_MUTEXHADR_AR_CRITICAL_SECTION_ENTRY
HADR_AR_MANAGER_MUTEX
HADR_AR_UNLOAD_COMPLETED
HADR_ARCONTROLLER_NOTIFICATIONS_SUBSCRIBER_LIST
HADR_BACKUP_BULK_LOCK
HADR_CLUSAPI_CALL
HADR_COMPRESSED_CACHE_SYNC
HADR_CONNECTIVITY_INFO
HADR_DATABASE_FLOW_CONTROL
HADR_DATABASE_VERSIONING_STATE
HADR_DATABASE_WAIT_FOR_RESTART
HADR_DATABASE_WAIT_FOR_TRANSITION_TO_VERSIONING
HADR_DB_COMMAND
HADR_DB_OP_COMPLETION_SYNC
HADR_DB_OP_START_SYNC
HADR_DBR_SUBSCRIBER
HADR_DBR_SUBSCRIBER_FILTER_LIST
HADR_DBSEEDING
HADR_DBSEEDING_LIST
HADR_DBSTATECHANGE_SYNC
HADR_FABRIC_CALLBACK
HADR_FILESTREAM_BLOCK_FLUSH
HADR_FILESTREAM_FILE_CLOSE
HADR_FILESTREAM_FILE_REQUEST
HADR_FILESTREAM_IOMGR
HADR_FILESTREAM_MANAGER
HADR_GROUP_COMMIT
HADR_LOGCAPTURE_SYNC
HADR_LOGCAPTURE_WAIT
HADR_LOGPROGRESS_SYNC
HADR_NOTIFICATION_DEQUEUE
HADR_NOTIFICATION_WORKER_EXCLUSIVE_ACCESS
HADR_NOTIFICATION_WORKER_STARTUP_SYNC
HADR_NOTIFICATION_WORKER_TERMINATION_SYNC
HADR_PARTNER_SYNC
HADR_READ_ALL_NETWORKS
HADR_RECOVERY_WAIT_FOR_CONNECTION
HADR_RECOVERY_WAIT_FOR_UNDO
HADR_REPLICAINFO_SYNC
HADR_SYNC_COMMIT
HADR_SYNCHRONIZING_THROTTLE
HADR_TDS_LISTENER_SYNC
HADR_TDS_LISTENER_SYNC_PROCESSING
HADR_TIMER_TASK
HADR_TRANSPORT_DBRLIST
HADR_TRANSPORT_FLOW_CONTROL
HADR_TRANSPORT_SESSION
HADR_WORK_POOL
HADR_WORK_QUEUE
HADR_XRF_STACK_ACCESS
See Also
All Wait Types


